By Steve Weisman
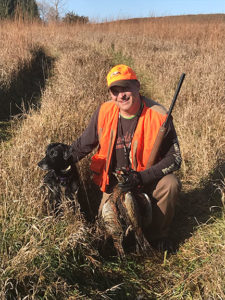
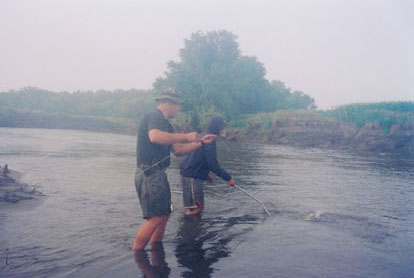
(photo by Steve Weisman) The author’s son with a limit of roosters taken on the 2018 opener.
The 2019 upland data for the DNR’s August roadside count has been collected and analyzed. After the snowy winter, late winter ice and rain followed by a wet and cold spring, there was fear that the pheasant and quail numbers would be down. Sadly enough, the roadside count numbers show those fears have been verified. It just seems that our upland game can’t get a break when it comes to the weather. The other part of the survival equation comes from habitat. As always, where there is a good mix of prairie grasses, food plots and water, the bird numbers remain steady.
Over the 57 years that the survey has been conducted, certain aspects have proven true: Iowa pheasant numbers increase with mild winters (less than 19 inches snowfall) followed by warm, dry springs (less than 6 inches rainfall). They decline with snowy winters (30 or more inches of snowfall) followed by cold, wet springs (8 or more inches of rainfall), and remain generally stable with average weather conditions, winters with 20–30 inches of snow and springs with 6–8 inches of rainfall.
Unfortunately, last winter’s state average snowfall was 39.1 inches with northwest Iowa receiving 36 inches. The total spring state rainfall average (April 1-MY 31) was 11 inches with northwest Iowa receiving an average of 11.3 inches. Of course, we know that after May there were some incredible rains and flooding in northwest Iowa.
2019 Upland Survey
Let’s take a look at key points from the 2019 August Upland Survey. The survey is prepared by Todd Bogenschutz, Upland Wildlife Research Biologist, and Mark McInroy, Upland Wildlife Research Technician. The August roadside survey generates data from approximately 218, 30-mile routes on ring-necked pheasants, bobwhite quail, gray partridge, cottontail rabbits, and white-tailed jackrabbits. Counts conducted on cool mornings when the sun is shining, with heavy dew, and no wind yield the most consistent results.
Historical survey data indicates overwinter hen survival, brood survival and nest success are the major factors influencing annual changes in pheasant numbers. Statewide, the total hens (-16 percent) and chicks (-21 percent) counted on routes this year were significantly lower than 2018, suggesting poor overwinter hen survival, nest success or chick survival compared to 2018. From a statewide perspective, poor winter hen survival and nest success contributed to most of this year’s decline as chick survival metrics were similar to 2018.
Statewide averages
This year the statewide pheasant index is 17.4 birds per route, which is lower than the 2018 estimate of 21 birds/route. Even so, his year’s statewide pheasant population index is still 21 percent above the 10- year trend but remains below the long-term average of 38.7 birds per route. Regionally only pheasant counts in the SC and SE regions were statistically lower than 2018. All other regions reported numbers comparable to 2018 with counts up or down slightly, but none were statistically significant, meaning there was no consistent trend in the counts, some routes increased, while others decreased in those regions.
In the past two years, the Central region has replaced the Northwest region with the highest bird counts in the state. In 2019, the Central region’s count was 28.2 birds per route with the WC region a close second at 27.2 birds/route and the NW at 24.1 birds per route. Counts in the C region are 30 percent above the 10-year average while counts in the WC region were 100 percent above the 10-year mean.
Northern county averages
Counts in the northern regions were unchanged from last year. Counts were down slightly in NW, up slightly in the NC and unchanged in the NE compared to 2018. Counts in all three regions were near or above their 10-year averages. Numbers for cocks, hens, and chicks in all three regions were unremarkable with about two-thirds of routes showing declines with the other third showing increases. The NW region averaged 24.3 birds per route, the third highest average of any region. Parts of NW and NC Iowa should offer good pheasant hunting, particularly around public and private lands with good winter habitat. Better counts in NW came from Clay, Dickinson, Emmet, Palo Alto, Plymouth and Osceola counties, while Humboldt, Kossuth, and Winnebago reported better numbers in the NC region.
Central counties
The WC region had the most routes reporting higher bird numbers. This region also had the most favorable winter and spring weather of any region. The region’s better hen and chick numbers reflects this more favorable weather. Reproductive parameters, particularly hens with brood, showed statistically lower trends in the C and EC regions. The WC and C regions should offer good to excellent hunting this fall where good quality pheasant habitat exists. The WC region reported better counts in Calhoun, Crawford, Sac, and Woodbury counties. The Central region reported good bird numbers in Hamilton, Marshall, Polk, Poweshiek, Story and Webster counties.
What it all means
The Iowa DNR forecasts that pheasant hunters will harvest between 200,000 to 275,000 rooster pheasants in 2019. At the same time, pheasant hunter numbers continue to decrease with only around 50,000 hunters afield in 2019. Obviously, better success will occur in areas with the better upland habitat. One of the big issues this year has to do with the late planting that took place. Look for lots and lots of corn and beans still in the field by the opener. I think we all know what a sanctuary standing crops are for pheasants. Depending on frost and drying conditions, it might be mid to late November before all the crops are out. At the same time, this should make the late hunting good.
Bobwhite quail
2018 was an exciting year for bobwhite quail hunters as numbers greatly increased. However, 2019’s survey shows a huge decline. Iowa’s statewide bobwhite quail index was 0.86 birds per route, a significant decrease over last year’s 1.37 birds per route. This decline was expected given the month of ice cover and subzero temperatures most of southern Iowa experience from late January thru the end of February. High winter mortality was expected with these weather conditions. Hunters reported harvesting more than 45,000 quail last fall, the state’s highest quail harvest in 11 years. Unfortunately, Iowa’s 5-year string of mild winters in this region disappeared last winter. The SC region reported the best overall quail numbers in 2019 followed by the SW region.
Gray Partridge
Gray partridge are found in the northern two-thirds of Iowa and prefer the wide-open agricultural lands. The 2019 gray partridge count was 1.3 birds per 30 miles and was statistically lower than last year’s 2.1 birds per route. Counts showed downward trends in all regions except the NE; however, only the decline in the EC region was statistically significant, which means a few routes increased in each region, but most others decreased and there was no consistent trend among routes. This year’s statewide estimate is 27 percent below the 10-year mean and 64 percent below the long-term mean.
Like pheasants and bobwhite quail, partridge numbers increase following mild winters and when spring/summer precipitation is below normal. In addition to the harsh winter and heavy spring rains, DNR data shows that icy conditions this past winter prevented snow burrowing and likely impacted reproduction this year. Better counts in 2019 came from Bremer, Buchanan, Floyd, Franklin, Grundy, Hamilton, Howard, Mitchell and Story counties.