 By Steve Weisman
The counts from the DNR’s annual August roadside count are back. Let’s break the data down and see what factors play into this roadside count. First off, to keep data consistent from year to year, the 215 routes are kept pretty much the same, and the goal is to complete a route on a morning where there is heavy dew. Of course, if it is a dry year, then there is less dew, and the counts may be less accurate than during wetter years. At the same time, foggy conditions can have an adverse affect on the count versus clear skies. So, there are always some variables in each count.
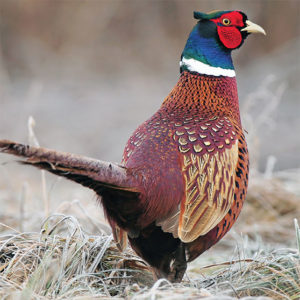
With the 2016 data collected and compiled, the statewide index is 20.7 birds per route, which is down slightly from 2015’s 23.9 average. It is still above the 10-year average, but that is a little misleading because 2011, 2012 and 2013 years showed 6.6, 7.8 and 6.5 birds per route, respectively. In 2007 and 2008 (the first two years of the 10-year average) the state average was 25.8 and 17.5 birds per route. The 10-year statewide average is 15.1 birds per route, while the long term average over the past 53 years of standardized roadside counts is 39.6, so we’re a long ways away from that long-term average.
Based on the statewide index of 21 birds per route, the DNR estimate that Iowa’s pheasant hunters should harvest between 300,000-400,000 roosters this fall.
A frustrating statistic for pheasant hunters is that in 2015, Iowa had 2.72 million acres of pheasant habitat, the lowest recorded level of habitat in Iowa since reliable record keeping began in 1900.
Northwest Region
As usual, the northwest region had the highest count average at 33 birds per route. Better counts came in Clay, Dickinson, Emmet, Lyon, Osceola, Palo Alto and Pocahontas counties. However, that average was down from 42.4 birds per route in 2015, but it is still above the 10-year average of 30.2 birds. Once again, this is somewhat misleading because 2011-2013 had counts of 11.1, 16.3 and 14.3, while the years 2007 and 2008 had 41.3 and 49.4 birds.
For the past 20 years, the northwest region has pretty much led the state in the average number of birds per route. The reason? In the 1990s it was the growth of the Conservation Reserve Program (CRP) and the number of state managed wildlife areas. As the acres in CRP have dropped, so has the amount of upland habitat, and the pheasant numbers have dwindled. Without these public lands, the pheasant numbers would be even further decimated.
So, if people live around or hunt those state lands or a private CRP tract, they often say, “We saw way more birds than the survey showed.” At the same time, those who hunt areas where there are only road ditches, cropland and a few waterways will often say, “We saw very few birds. I don’t know where they get their numbers.” The bottom line is habitat makes a huge difference.
Finally, of course there is Mother Nature. Too much snow, a huge multi-day blizzard, a crust on the snow so the birds can’t get to the food, intense cold and wind and a late winter/early spring heavy snow can all greatly impact the pheasant population.
At the same time, heavy rains in the spring and early summer can destroy nests and kill baby chicks, and sometimes kill the hen. Add in a bad hailstorm, and a local population can be decimated. Sometimes, these weather events are just in certain areas or maybe even just a few mile radius…at other times, an entire region can be hit or even the entire state.
So, the roadside counts become statistical averages and the addition or loss of habitat and huge weather events become a part of this statistical average.
In the end, we know that Mother Nature is going to do her thing. At times, the yearly weather conditions are mild and the pheasant population responds positively. At other times, severe weather hits and the pheasant population drops. The real answer to a consistently strong pheasant population is habitat that provides good nesting cover and protection during the winter. As the 2016 report concludes, it will be very hard to recover Iowa pheasant numbers any further if significant CRP or other habitat losses continue.
Here is a little more about habitat losses, the 2014 farm bill and habitat options that were published in the roadside report under the heading “Upland Habitat Trends in Iowa.” Information from the USDA shows that between 1990 and 2015, Iowa lost 2,984 miles of potential pheasant habitat. This habitat was a mix of small grains, hay land and CRP acres. To put this loss in perspective, 2984 miles is a strip of habitat 10 miles wide that would stretch from Omaha to Davenport.
Nationally, the 2014 Farm Bill reduced the CRP program from a 32 million acre program to a 24 million acre program. The USDA’s June report shows Iowa has 1,689, 015 acres enrolled with 214,997 acres expiring in September of 2017. Opportunities to enroll additional land into CRP in Iowa seem very limited. However, Congress will begin discussion of the 2018 Farm Bill early next year, and hopefully there will be support in increase the acres cap.
Iowa does have two special continuous CRP practices that are beneficial to all upland game. Iowa has requested for addition CRP acres in both practices. Interested landowners can visit www.iowadnr.gov/habitat for more information about CP38.
In addition, the DNR was awarded a $3 million grant from the USDA to expand the state’s walk-in hunting program, Iowa Habitat and Access Program. This program helps landowners plant CRP where the DNR has provided incentives to manage habitat for landowners in exchange for public hunting access. A total of 25,000 acres have been enrolled into this program. To learn more about this program, visit http://www.iowadnr.gov/ihap.
It really comes down to priorities and decisions. As Iowans, what do we want our landscape to look like? As landowners, are there ways to have the best of both worlds: corn and soybean fields mixed in with upland habitat (tall grass prairies) on the land that is more erodible or more susceptible to lowland flooding and replanting?

